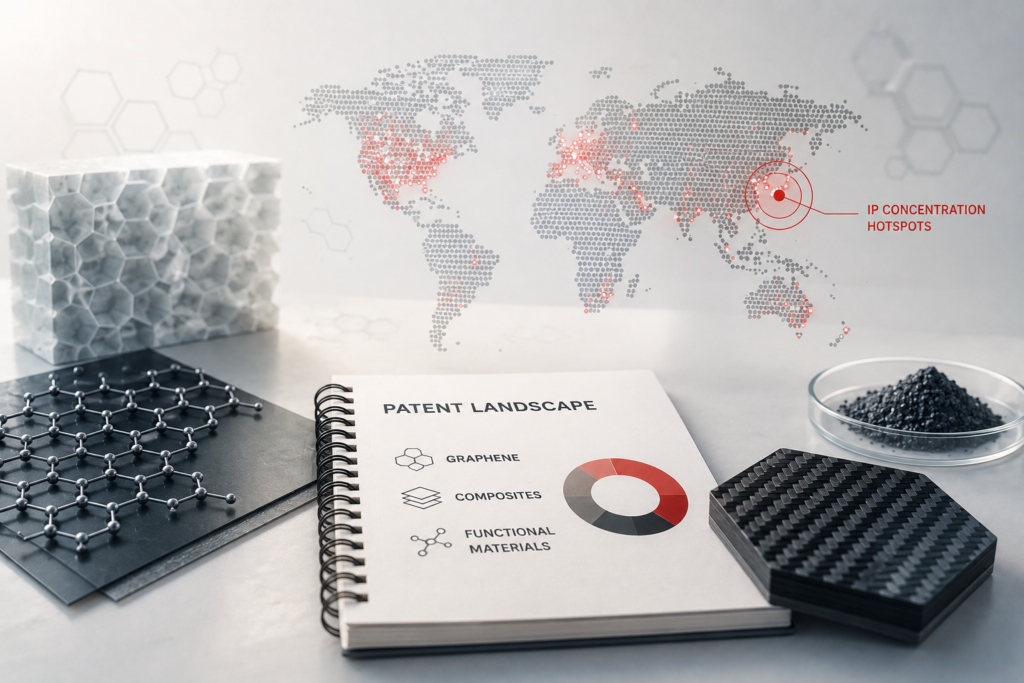
Introduction
In the ever-evolving world of patent litigation, there’s a powerful duo that can make or break a case: Evidence of Use (EoU) and Claim Charts. Imagine them as the Sherlock Holmes and Watson of the patent world, meticulously dissecting the intricacies of technology and law to unravel the mysteries of infringement or non-infringement.
In cases involving patent invalidation, these tools become indispensable for navigating the patent invalidation process, helping to invalidate patents through thorough documentation and detailed comparisons.
Table of Contents
Understanding EoU (Evidence of Use) and Claim Charts
Evidence of Use (EoU) and Claim Charts are critical tools in the world of patent litigation and patent invalidation. They often determine the success or failure of a case, particularly when trying to invalidate a patent.
Evidence of Use (EoU) Chart
EoU is essentially the proof presented in a legal dispute to demonstrate that a patent’s claims are being used, either legitimately or illegitimately, in the marketplace. It’s about connecting the dots between a patented invention and its practical application in a product or process.
This plays a key role in both asserting infringement and challenging a patent during the patent invalidation process.
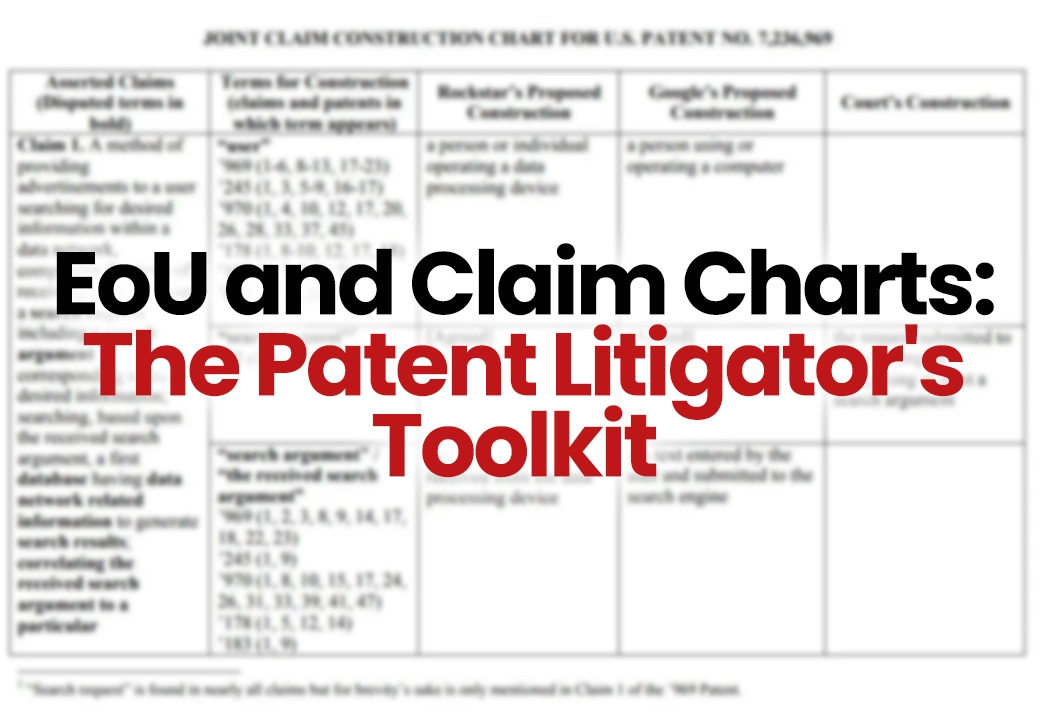
Claim Chart
Claim Charts, on the other hand, are detailed documents used to illustrate this connection. They are organized in a tabular format, typically with two primary columns.
The first column lists the specific claims of a patent, broken down into their individual elements. The second column is where the evidence of use is placed, showing how each element of the patent claim is embodied in the accused product or process.
These charts require not only a deep understanding of the patent but also an understanding of how prior art and existing products relate to invalidate patents in patent invalidation searches. This is particularly important when conducting an ai patent invalidation search or preparing for litigation to invalidate US patents.
These charts are not just a simple comparison; they require a deep understanding of both the patent and the technology it covers. Creating an effective claim chart involves a thorough analysis of the patent, dissecting each claim to understand its scope and limitations.
Simultaneously, it requires a meticulous examination of the accused product or process to identify corresponding features or methods that may infringe upon the patent.
Uses In Litigation
EoU and Claim Charts serve as a foundation for various strategic decisions in patent invalidation US cases. They are used in court to show how a defendant’s product infringes a patent.
Claim Charts are also vital when arguing against the novelty or validity of a patent, providing a visual and documented representation of how prior art invalidates the claims in question. This forms the backbone of a patent invalidity search report.
Conversely, they can also be used to demonstrate non-infringement or to challenge the validity of a patent by showing that the claims are either too broad or not novel.
For IP lawyers, these charts are indispensable in preparing for litigation, aiding in the development of legal strategies, and in communicating complex technical details in an accessible manner to judges or juries.
For innovators and companies, understanding EoU/Claim Charts is crucial for protecting their inventions, assessing the risk of infringement, and making informed decisions about product development and business strategy.
About TTC
At TT Consultants, we deliver integrated solutions for market intelligence, technology consultancy, IP, and innovation management. Our approach combines advanced analytics with deep industry expertise to provide actionable insights, helping businesses navigate complex markets and dynamic technological landscapes. We IMAGINE, ADAPT, and EXECUTE to meet the evolving strategic needs of our clients.
Our team consists of experienced market analysts, technology consultants, core subject matter experts (graduates, master’s, and PhDs), IP attorneys, former USPTO examiners, and industry strategists. We collaborate with Fortune 500 companies, innovators, law firms, universities, and financial institutions across diverse industries.
Our services include (but are not limited to) Market Analysis, Opportunity Analysis, Regulatory Landscapes, Competitive Intelligence, Technology Scouting, Technology Assessment, Forecasting of Technological Trends, Landscape Analysis, Whitespace Identification, Patent Research, and strategic market entry studies.
These services enable our clients to seize new opportunities and maintain a competitive edge.
We guide companies through product development, portfolio optimization, and commercialization strategies, ensuring sustainable growth in today’s fast-evolving markets.
Preparing Effective Claim Charts
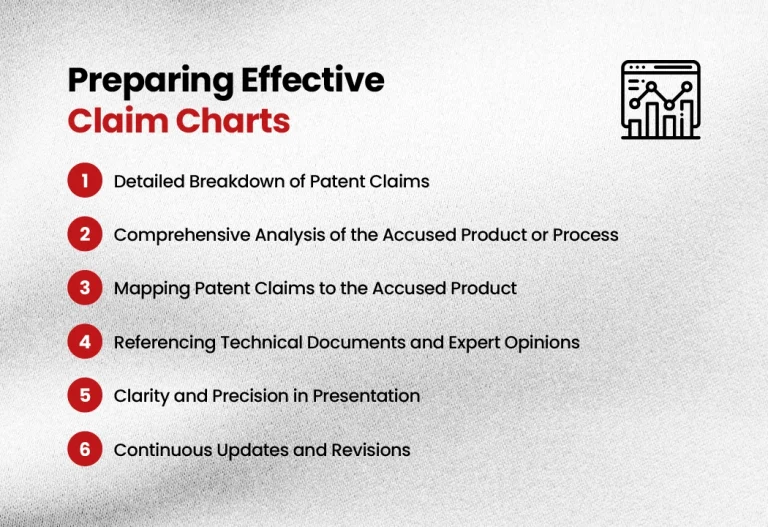
Creating an effective claim chart is a vital skill for anyone involved in patent litigation. It’s a detailed process that requires precision, legal knowledge, and a good grasp of technical details. Here’s how you can prepare a claim chart that not only holds up in court but also clearly communicates your position.
l) Detailed Breakdown of Patent Claims
Start by dissecting each claim of the patent. Break down the claims into individual elements or steps. This granular approach helps in thoroughly understanding the scope of the patent and prepares you for a detailed comparison.
ll) Comprehensive Analysis of the Accused Product or Process
Conduct an in-depth analysis of the product or process being accused of infringement. Understand its workings, features, and how it aligns with the technology or process described in the patent. This step is crucial as it forms the basis of your comparison.
lll) Mapping Patent Claims to the Accused Product
This is where you align the elements of the patent claims with specific features or processes of the accused product. For each element in the patent claim, provide a corresponding feature or process in the product. Include detailed explanations and, if possible, visual representations to strengthen your argument.
lV) Referencing Technical Documents and Expert Opinions
Support your claim chart with technical documents, such as product manuals, technical specifications, or expert analysis. These references add credibility and depth to your chart, making your argument more persuasive.
V) Clarity and Precision in Presentation
The effectiveness of a claim chart lies in its clarity. Ensure that the chart is easy to understand, with a logical flow and concise language. Avoid technical jargon that might obscure your argument, and present the information in a way that is accessible to those without a technical background.
Vl) Continuous Updates and Revisions
Patent litigation can be a dynamic process, with new information coming to light during the course of a case. Be prepared to update and revise your claim charts accordingly. This flexibility ensures that your chart remains relevant and accurate throughout the litigation process.
An effective claim chart serves as a powerful tool in patent litigation. It not only helps in asserting your position but also aids in streamlining the litigation process by presenting clear, concise, and compelling evidence of use or non-infringement.
Uses of EoU/Claim Charts Beyond Litigation
While EoU/Claim Charts are primarily associated with patent litigation, their utility extends far beyond the courtroom. These tools are invaluable in various aspects of intellectual property management and business strategy.
l) Patent Portfolio Management
For companies with extensive patent portfolios, EoU/Claim Charts are essential in assessing the value and strength of their patents. By analyzing how a patent is being utilized in the market, companies can identify key assets, prioritize their patent maintenance efforts, and make informed decisions on patent renewals.
ll) Licensing and Negotiations
EoU/Claim Charts are powerful in licensing discussions. They provide a clear demonstration of how a licensee’s products or processes align with the patent, making it easier to establish the value of a license. This clarity can lead to more productive negotiations and fair licensing terms.
lll) Patent Transactions
When buying or selling patents, EoU/Claim Charts offer critical insights into the applicability and breadth of the patents in question. They help in evaluating the potential return on investment and in conducting due diligence during patent transactions.
lV) Strategic Planning and Innovation Management
For innovators and R&D teams, EoU/Claim Charts can be a roadmap for future innovation. By understanding how existing patents are being used in the market, companies can identify areas ripe for innovation, avoid infringement risks, and strategically direct their R&D efforts.
V) Competitive Intelligence
EoU/Claim Charts are a window into competitors’ patent utilization. Companies can use this intelligence to stay ahead of market trends, anticipate competitor moves, and adapt their strategies accordingly.
Vl) Risk Assessment and Avoidance
Before launching a new product or entering a new market, EoU/Claim Charts help in assessing potential patent infringement risks. This proactive approach can save companies from costly litigation and business disruptions.
Strategic Use of Claim Charts in Litigation
Claim charts are not just tools for presentation in court; they are strategic assets in patent litigation. Their use can significantly influence the course and outcome of legal disputes.
Here’s how they can be strategically employed:
l) Pre-Litigation Analysis
Before litigation even begins, claim charts are instrumental in assessing the strength of a case. They help in evaluating the validity of the claims and the likelihood of infringement. This preliminary analysis can inform decisions on whether to pursue litigation or seek an alternative resolution.
ll) Infringement and Validity Contentions
In the thick of litigation, claim charts are used to articulate infringement and validity contentions. They provide a structured way to present how each element of the patent claim is met (or not met) by the accused product, offering clear and direct evidence to support legal arguments.
lll) Facilitating Settlements and Negotiations
The clarity provided by claim charts can pave the way for settlements. By clearly delineating the points of contention, they can help both parties understand the strengths and weaknesses of their positions, often leading to more reasoned negotiations.
lV) Trial
In the courtroom, claim charts are invaluable for jury communication. They break down complex patent issues into understandable segments, helping juries comprehend the technical aspects of the case and the points of infringement.
V) Post-Trial and Appeals
Even after a trial, claim charts continue to be useful. They serve as a reference in post-trial motions and appeals, providing a consistent and comprehensive record of the infringement arguments.
Claim charts, thus, are more than evidentiary documents; they are strategic tools that shape the trajectory of patent litigation. Their preparation and use require not only legal acumen but also a deep understanding of the technology in question and the ability to present complex information in a clear, compelling manner.
Common Challenges and Solutions in EoU/Claim Chart Preparation
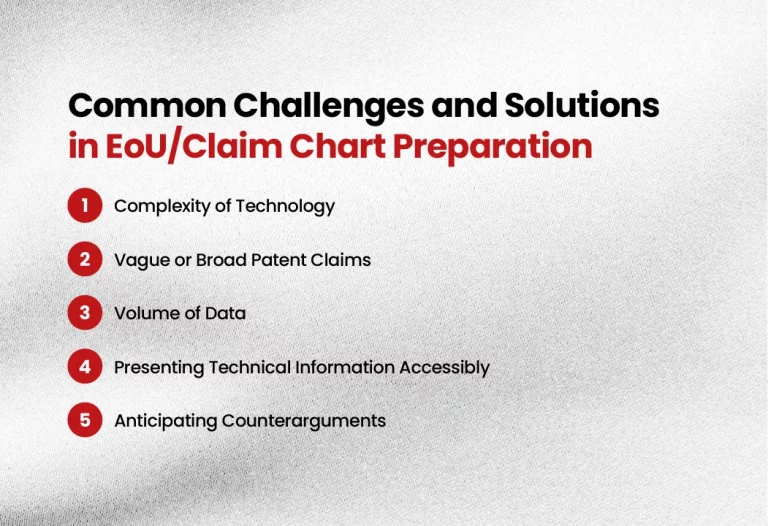
Navigating the preparation of EoU/Claim Charts can be a complex task, often fraught with challenges. Understanding these common hurdles and knowing how to tackle them is key to creating effective and persuasive charts.
Complexity of Technology: One of the biggest challenges is dealing with the complexity of the technology involved in the patent. This can make it difficult to clearly map patent claims to the accused product or process.
Solution: Collaborate with technical experts or engineers who understand the technology. Their insights can help clarify complex technical aspects and ensure accurate representation in the claim chart.
Vague or Broad Patent Claims: Sometimes, patent claims can be overly broad or not clearly defined, making it challenging to establish a direct link to the accused product.
Solution: In such cases, it’s important to conduct a thorough patent analysis and, if necessary, seek a claim construction ruling (Markman hearing) to clarify the scope of the claims.
Volume of Data: In cases involving complex products or processes, the sheer volume of data can be overwhelming, making it challenging to identify relevant evidence.
Solution: Employ a systematic approach to data collection and analysis. Utilize software tools for managing and analyzing large datasets. Breaking down the task into smaller, manageable parts can also help.
Presenting Technical Information Accessibly: A common pitfall is creating claim charts that are too technical or complex for judges or juries to understand.
Solution: Focus on clarity and simplicity. Use plain language and visual aids like diagrams or graphs to make technical information more accessible. Remember, the goal is to communicate effectively with a non-technical audience.
Anticipating Counterarguments: Another challenge is anticipating and addressing potential counterarguments from the opposing party.
Solution: Approach your claim chart preparation with a critical eye. Try to foresee potential counterarguments and address them preemptively in your chart.
By being aware of these challenges and employing strategic solutions, you can enhance the effectiveness of your EoU/Claim Charts, making them powerful tools in patent litigation.
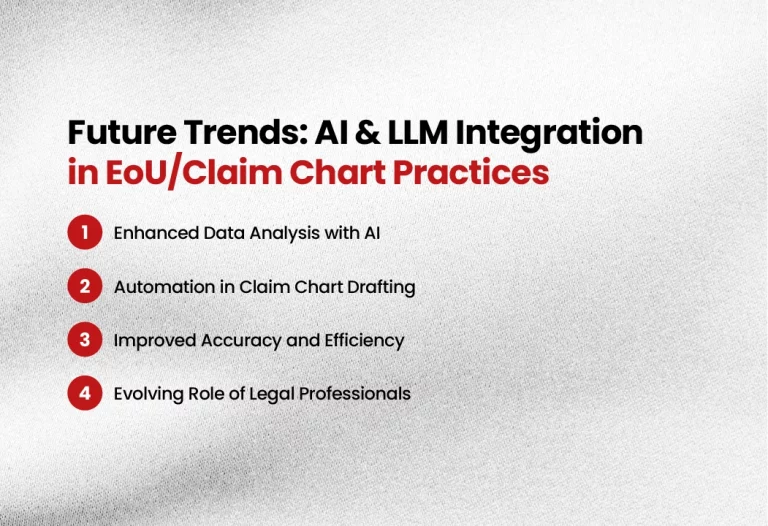
Future Trends: AI & LLM Integration in EoU/Claim Chart Practices
The landscape of patent litigation and EoU/Claim Chart preparation is evolving, with artificial intelligence (AI) and large language models (LLMs) beginning to play a significant role. Let’s explore how these technological advancements are shaping the future.
l) Enhanced Data Analysis with AI
AI algorithms are becoming increasingly adept at processing large volumes of data, a task that is often overwhelming in complex patent cases. AI can quickly sift through thousands of documents, identify relevant information, and assist in creating more accurate and comprehensive EoU/Claim Charts.
ll) Automation in Claim Chart Drafting
With advancements in AI and LLMs, we are beginning to see the automation of certain aspects of claim chart drafting. These technologies can assist in the initial drafting of claim charts by automatically mapping patent claims to relevant portions of technical documentation.
lll) Improved Accuracy and Efficiency
AI tools can enhance the accuracy of claim charts by ensuring that no relevant evidence is overlooked. They can also speed up the preparation process, allowing lawyers to focus on strategy and analysis rather than on time-consuming data collection and organization.
lV) Evolving Role of Legal Professionals
As AI and LLMs become more integrated into the process, the role of lawyers and paralegals will evolve. The focus will shift towards interpreting and strategizing based on the data and drafts provided by AI, with a greater emphasis on legal judgment and creativity.
The integration of AI and LLMs in EoU/Claim Chart practices is not just a futuristic concept; it’s a burgeoning reality that promises to transform patent litigation. As these technologies continue to advance, they will undoubtedly bring new capabilities, efficiencies, and challenges to the field.
Conclusion
In the intricate dance of patent litigation, EoU/Claim Charts are not just footnotes; they are the choreography that can lead to a winning performance. We’ve journeyed through the essentials of what these tools are, their preparation, strategic use in and out of the courtroom, the challenges involved, and the promising future shaped by AI and LLM technologies.
Remember, whether you’re an IP lawyer, an innovator, or a business leader, the effectiveness of your claim charts can be the deciding factor in a patent dispute. These charts are more than mere documents; they are the narrative of your patent story, told in a way that’s compelling, clear, and legally sound.
About TTC
At TT Consultants, we're a premier provider of custom intellectual property (IP), technology intelligence, business research, and innovation support. Our approach blends AI and Large Language Model (LLM) tools with human expertise, delivering unmatched solutions.
Our team includes skilled IP experts, tech consultants, former USPTO examiners, European patent attorneys, and more. We cater to Fortune 500 companies, innovators, law firms, universities, and financial institutions.
Services:
- Patentability Search
- Invalidation Search
- Freedom to Operate (FTO) Analysis
- Patent Portfolio Management
- Patent Infringement Searches
- Drafting & Illustrations
- Competitive Benchmarking
- Technology Scouting
- Landscape Analysis
- Whitespace Analysis
- Business Research
Choose TT Consultants for tailored, top-quality solutions that redefine intellectual property management.
Contact Us